
Page 60 - rohana_journal_No_12-2020-final
P. 60
Research Journal of the University of Ruhuna, Sri Lanka- Rohana 12, 2020
Bangladesh were more attractive for FDI inflows compared to Sri Lanka and
Pakistan.
Ravinthirakumaran et al. (2015) conducted a study where to estimate (is estimate
correct here? If not should use a word like analyse) determinants of FDI inflows to
Sri Lanka applying the ARDL bound test method based on the annual data for the
period of 1978 -2013. The study found that market size, trade openness and
infrastructure have a positive impact, whereas wage and political instability have a
negative impact on FDI.
The Trends in FDI in Sri Lanka
It is worthy to explore the trends in FDI inflows and its impact on the economy of
Sri Lanka by making linkages with economic growth, foreign trade, and domestic
investment. This section discusses FDI data in Sri Lanka in an historical perspective.
After the political independence in 1948, the Sri Lankan economy experienced
major policy changes. These policy changes have changed the country’s economy in
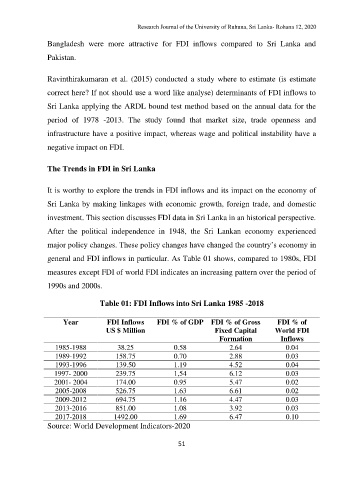
general and FDI inflows in particular. As Table 01 shows, compared to 1980s, FDI
measures except FDI of world FDI indicates an increasing pattern over the period of
1990s and 2000s.
Table 01: FDI Inflows into Sri Lanka 1985 -2018
Year FDI Inflows FDI % of GDP FDI % of Gross FDI % of
US $ Million Fixed Capital World FDI
Formation Inflows
1985-1988 38.25 0.58 2.64 0.04
1989-1992 158.75 0.70 2.88 0.03
1993-1996 139.50 1.19 4.52 0.04
1997- 2000 239.75 1,54 6.12 0.03
2001- 2004 174.00 0.95 5.47 0.02
2005-2008 526.75 1.63 6.61 0.02
2009-2012 694.75 1.16 4.47 0.03
2013-2016 851.00 1.08 3.92 0.03
2017-2018 1492.00 1.69 6.47 0.10
Source: World Development Indicators-2020
51