
Page 70 - rohana_journal_No_12-2020-final
P. 70
Research Journal of the University of Ruhuna, Sri Lanka- Rohana 12, 2020
the two critical values, for a given significance level can be tested the existence of
cointegration among the variables (Pesaran et al., 2001).
Assuming that all variables are integrated of I(0), the lower bound is calculated, and
by assuming all variables are integrated of I(1) the upper bound is calculated.
Accordingly, if the estimated F- statistic is lower than the lower critical bound value
the null hypothesis is accepted, while the null hypothesis (no cointegration) is
rejected when the computed F- statistic is higher than the upper critical bound value.
However, if the estimated F- statistic is located within the two critical values the
cointegration test is inconclusive.
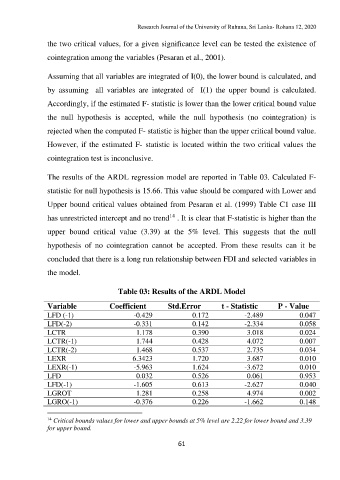
The results of the ARDL regression model are reported in Table 03. Calculated F-
statistic for null hypothesis is 15.66. This value should be compared with Lower and
Upper bound critical values obtained from Pesaran et al. (1999) Table C1 case III
14
has unrestricted intercept and no trend . It is clear that F-statistic is higher than the
upper bound critical value (3.39) at the 5% level. This suggests that the null
hypothesis of no cointegration cannot be accepted. From these results can it be
concluded that there is a long run relationship between FDI and selected variables in
the model.
Table 03: Results of the ARDL Model
Variable Coefficient Std.Error t - Statistic P - Value
LFD (-1) -0.429 0.172 -2.489 0.047
LFD(-2) -0.331 0.142 -2.334 0.058
LCTR 1.178 0.390 3.018 0.024
LCTR(-1) 1.744 0.428 4.072 0.007
LCTR(-2) 1.468 0.537 2.735 0.034
LEXR 6.3423 1.720 3.687 0.010
LEXR(-1) -5.963 1.624 -3.672 0.010
LFD 0.032 0.526 0.061 0.953
LFD(-1) -1.605 0.613 -2.627 0.040
LGROT 1.281 0.258 4.974 0.002
LGRO(-1) -0.376 0.226 -1.662 0.148
14 Critical bounds values for lower and upper bounds at 5% level are 2.22 for lower bound and 3.39
for upper bound.
61