
Page 110 - Proceedings-edit-2021_09_20-final
P. 110
© Proceedings of the Ruhuna Quality Assurance Sessions 2021 (RUQAS 2021)
st
21 September 2021
been increased by more than 20 min on average. It should be noted that this excess time is not accounted for
overtime claims. It is the utilization of the time wasted for transportation in a productive way. The employees
are not required to spend time on arranging their transport as the time before November 2020. They are mentally
relaxed since they have a method of transportation. Thus, it is reasonable to assume that this time gain will
impact positively towards the employee productivity.
These employees are entitled to have two short leaves per month. A significant decline was observed in the
number of short leave days taken by the staff who are regularly using this transport service. Accordingly, this
encourages the long working hours, sacrificing that short leave entitlement in the benefit of a relaxed mindset
with the release from exhausted commuting.
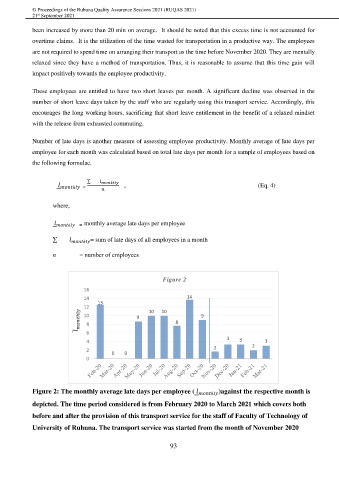
Number of late days is another measure of assessing employee productivity. Monthly average of late days per
employee for each month was calculated based on total late days per month for a sample of employees based on
the following formulae.
∑ ℎ
ℎ = , (Eq. 4)
where,
ℎ = monthly average late days per employee
∑ ℎ = sum of late days of all employees in a month
n = number of employees
Figure 2
16
14 13 14
12
10 10
10 9 9
8
8
6
3
4 3 3
2
2 2
0 0
0
Figure 2: The monthly average late days per employee ( ℎ )against the respective month is
depicted. The time period considered is from February 2020 to March 2021 which covers both
before and after the provision of this transport service for the staff of Faculty of Technology of
University of Ruhuna. The transport service was started from the month of November 2020
93