
Page 111 - Proceedings-edit-2021_09_20-final
P. 111
© Proceedings of the Ruhuna Quality Assurance Sessions 2021 (RUQAS 2021)
st
21 September 2021
The monthly average of late days per employee ( ℎ ) against the respective month is depicted in
Figure 2. The number of late days were retained at a high level which ranges from eight days to
fourteen days until October 2020. From November 2020, the number of late days have drastically
decreased with the provision of this transport service. Furthermore, in an ideal situation the number of
late days would be zero in which bus arrival and departure times are more organized, considering the
factors such as traffic congestion.
Apart from the above improvements, reduction in time spent for transportation and mental relaxation
are some other benefits associated with this transport service. The survey was conducted via a
questionnaire to collect data on the above aspects and the responses of staff of the Faculty of
Technology were reviewed. Time saving is measured with the gap between, time spent with
public/private transportation for daily commuting and time spent with university transport for daily
commuting. The responses of twenty-three employees using this transport service are considered to
investigate this.
Figure 3
8
Time spent for transportation(hours) 6 5 4 3 2
7
1
0
number
1 2 3 4 5 6 7 8 9 10 11 12 13 14 15 16 17 18 19 20 21 22 23 Employee
Time spent with public/private transportation before using university transportation
for daily commuting (per day)
Time spending with university transport for daily commuting (per day)
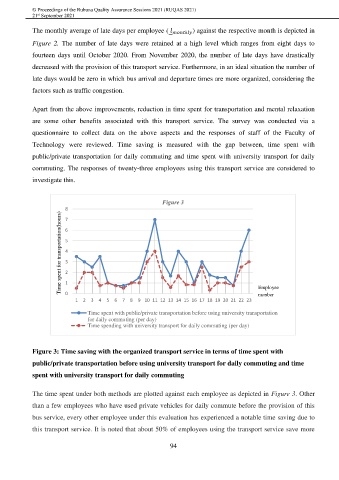
Figure 3: Time saving with the organized transport service in terms of time spent with
public/private transportation before using university transport for daily commuting and time
spent with university transport for daily commuting
The time spent under both methods are plotted against each employee as depicted in Figure 3. Other
than a few employees who have used private vehicles for daily commute before the provision of this
bus service, every other employee under this evaluation has experienced a notable time saving due to
this transport service. It is noted that about 50% of employees using the transport service save more
94