
Page 109 - Proceedings-edit-2021_09_20-final
P. 109
© Proceedings of the Ruhuna Quality Assurance Sessions 2021 (RUQAS 2021)
st
21 September 2021
The attendance records of each employee throughout a month are considered in calculating the
monthly averages. The attendance records of different days of an employee can be considered as
independent events. Thus the total number of independent data samples (Ns) per month can be
considered as = × , where Md is the number of working days for the month and Ne is the
number of employees. The monthly average of working hours per employee per day ( ) is calculated
using the equation.
∑ ,
= (Eq. 2)
For each month about 100 attendance records ( ≈ 100) were considered in computing the monthly
average of working hours per employee per day ( ).
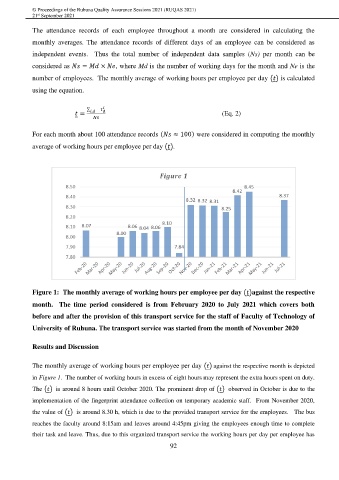
Figure 1: The monthly average of working hours per employee per day ( )against the respective
month. The time period considered is from February 2020 to July 2021 which covers both
before and after the provision of this transport service for the staff of Faculty of Technology of
University of Ruhuna. The transport service was started from the month of November 2020
Results and Discussion
The monthly average of working hours per employee per day ( ) against the respective month is depicted
in Figure 1. The number of working hours in excess of eight hours may represent the extra hours spent on duty.
The ( ) is around 8 hours until October 2020. The prominent drop of ( ) observed in October is due to the
implementation of the fingerprint attendance collection on temporary academic staff. From November 2020,
the value of ( ) is around 8.30 h, which is due to the provided transport service for the employees. The bus
reaches the faculty around 8:15am and leaves around 4:45pm giving the employees enough time to complete
their task and leave. Thus, due to this organized transport service the working hours per day per employee has
92