
Page 23 - rohana_journal_No_13-2020-PRINT_03_of_03 -edit-2023_07-corre
P. 23
Research Journal of the University of Ruhuna, Sri Lanka- Rohana 13, 2021
Statistical Analysis
All data on fish growth performance were statistically analyzed by one-way analysis
of variance (ANOVA), using Student-Newman- Keuls test for individual
comparisons (p<0.05 level of significance). Non- parametric Kruskal Wallis test was
used for comparison of water quality parameters in fish tanks since these data were
not normally distributed. Student-Newman-Keuls test was used to find the
significantly different treatment groups. All statistical analyses were carried out
using the SPSS version 17.
Results
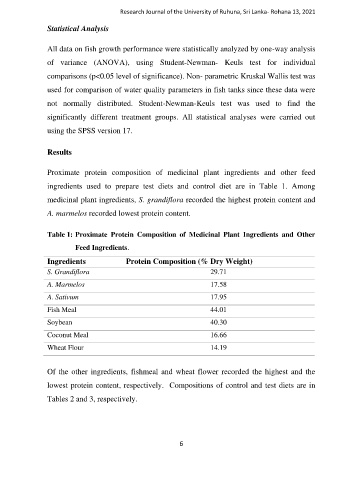
Proximate protein composition of medicinal plant ingredients and other feed
ingredients used to prepare test diets and control diet are in Table 1. Among
medicinal plant ingredients, S. grandiflora recorded the highest protein content and
A. marmelos recorded lowest protein content.
Table 1: Proximate Protein Composition of Medicinal Plant Ingredients and Other
Feed Ingredients.
Ingredients Protein Composition (% Dry Weight)
S. Grandiflora 29.71
A. Marmelos 17.58
A. Sativum 17.95
Fish Meal 44.01
Soybean 40.30
Coconut Meal 16.66
Wheat Flour 14.19
Of the other ingredients, fishmeal and wheat flower recorded the highest and the
lowest protein content, respectively. Compositions of control and test diets are in
Tables 2 and 3, respectively.
6