
Page 25 - rohana_journal_No_13-2020-PRINT_03_of_03 -edit-2023_07-corre
P. 25
Research Journal of the University of Ruhuna, Sri Lanka- Rohana 13, 2021
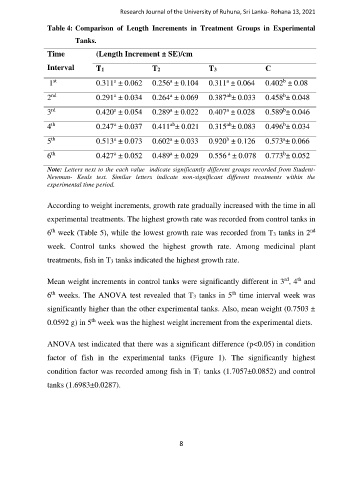
Table 4: Comparison of Length Increments in Treatment Groups in Experimental
Tanks.
Time (Length Increment ± SE)/cm
Interval T1 T2 T3 C
weeks 0.311 ± 0.062 0.256 ± 0.104 0.311 ± 0.064 0.402 ± 0.08
b
a
st
a
a
1
b
nd
ab
a
a
2 0.291 ± 0.034 0.264 ± 0.069 0.387 ± 0.033 0.458 ± 0.048
a
rd
a
a
b
3 0.420 ± 0.054 0.289 ± 0.022 0.407 ± 0.028 0.589 ± 0.046
ab
th
a
b
ab
4 0.247 ± 0.037 0.411 ± 0.021 0.315 ± 0.083 0.496 ± 0.034
a
a
th
b
a
5 0.513 ± 0.073 0.602 ± 0.033 0.920 ± 0.126 0.573 ± 0.066
th
a
b
a
a
6 0.427 ± 0.052 0.489 ± 0.029 0.556 ± 0.078 0.773 ± 0.052
Note: Letters next to the each value indicate significantly different groups recorded from Student-
Newman- Keuls test. Similar letters indicate non-significant different treatments within the
experimental time period.
According to weight increments, growth rate gradually increased with the time in all
experimental treatments. The highest growth rate was recorded from control tanks in
nd
th
6 week (Table 5), while the lowest growth rate was recorded from T3 tanks in 2
week. Control tanks showed the highest growth rate. Among medicinal plant
treatments, fish in T3 tanks indicated the highest growth rate.
rd
th
Mean weight increments in control tanks were significantly different in 3 , 4 and
th
th
6 weeks. The ANOVA test revealed that T3 tanks in 5 time interval week was
significantly higher than the other experimental tanks. Also, mean weight (0.7503 ±
th
0.0592 g) in 5 week was the highest weight increment from the experimental diets.
ANOVA test indicated that there was a significant difference (p<0.05) in condition
factor of fish in the experimental tanks (Figure 1). The significantly highest
condition factor was recorded among fish in T1 tanks (1.7057±0.0852) and control
tanks (1.6983±0.0287).
8