
Page 26 - rohana_journal_No_13-2020-PRINT_03_of_03 -edit-2023_07-corre
P. 26
Research Journal of the University of Ruhuna, Sri Lanka- Rohana 13, 2021
Table 5: Comparison of Weight Increments Among Treatments Groups in
Experimental Tanks.
Time (Mean Length Increment ± SE)/cm
Interval T1 T2 T3 C
weeks 0.113 ± 0.012 0.085 ± 0.005 0.172 ± 0.007 0.227 ± 0.010
a
st
c
b
a
1
2 0.069 ± 0.015 0.095 ± 0.003 0.052 ± 0.001 0.138 ± 0.011
a
ab
b
nd
c
b
rd
a
a
a
3 0.179 ± 0.010 0.113 ± 0.005 0.191 ± 0.005 0.331 ± 0.056
b
a
a
th
a
4 0.107 ± 0.011 0.175 ± 0.004 0.188 ± 0.042 0.329 ± 0.024
b
a
b
5 0.325 ± 0.040 0.393 ± 0.032 0.750 ± 0.059 0.711 ± 0.035
th
a
b
a
th
a
6 0.361 ± 0.042 0.372 ± 0.033 0.425 ± 0.058 0.945 ± 0.085
a
Note: Letters next to the each value indicate significantly different groups recorded from Student-
Newman- Keuls test. Similar letters indicate no-significant difference within the experimental time
period.
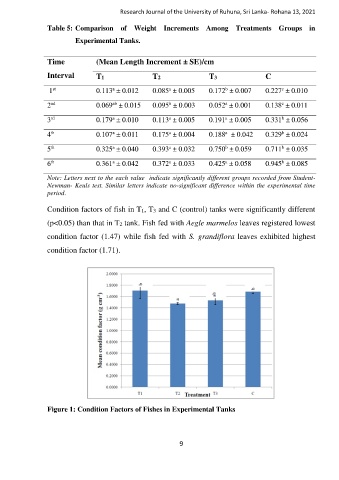
Condition factors of fish in T1, T3 and C (control) tanks were significantly different
(p<0.05) than that in T2 tank. Fish fed with Aegle marmelos leaves registered lowest
condition factor (1.47) while fish fed with S. grandiflora leaves exhibited highest
condition factor (1.71).
Figure 1: Condition Factors of Fishes in Experimental Tanks
9