
Page 24 - rohana_journal_No_13-2020-PRINT_03_of_03 -edit-2023_07-corre
P. 24
Research Journal of the University of Ruhuna, Sri Lanka- Rohana 13, 2021
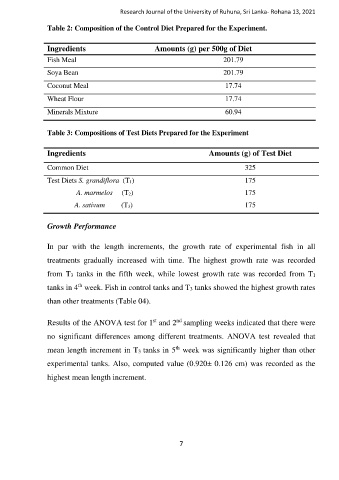
Table 2: Composition of the Control Diet Prepared for the Experiment.
Ingredients Amounts (g) per 500g of Diet
Fish Meal 201.79
Soya Bean 201.79
Coconut Meal 17.74
Wheat Flour 17.74
Minerals Mixture 60.94
Table 3: Compositions of Test Diets Prepared for the Experiment
Ingredients Amounts (g) of Test Diet
Common Diet 325
Test Diets S. grandiflora (T1) 175
A. marmelos (T2) 175
A. sativum (T3) 175
Growth Performance
In par with the length increments, the growth rate of experimental fish in all
treatments gradually increased with time. The highest growth rate was recorded
from T3 tanks in the fifth week, while lowest growth rate was recorded from T1
th
tanks in 4 week. Fish in control tanks and T3 tanks showed the highest growth rates
than other treatments (Table 04).
st
nd
Results of the ANOVA test for 1 and 2 sampling weeks indicated that there were
no significant differences among different treatments. ANOVA test revealed that
th
mean length increment in T3 tanks in 5 week was significantly higher than other
experimental tanks. Also, computed value (0.920± 0.126 cm) was recorded as the
highest mean length increment.
7