
Page 163 - Proceedings-edit-2021_09_20-final
P. 163
© Proceedings of the Ruhuna Quality Assurance Sessions 2021 (RUQAS 2021)
st
21 September 2021
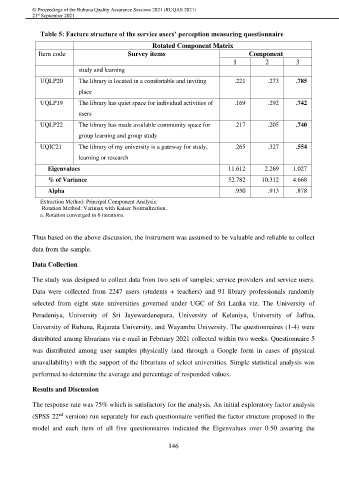
Table 5: Facture structure of the service users’ perception measuring questionnaire
Rotated Component Matrix
Item code Survey items Component
1 2 3
study and learning
UQLP20 The library is located in a comfortable and inviting .221 .273 .785
place
UQLP19 The library has quiet space for individual activities of .169 .292 .742
users
UQLP22 The library has made available community space for .217 .205 .740
group learning and group study
UQIC21 The library of my university is a gateway for study, .265 .327 .554
learning or research
Eigenvalues 11.612 2.269 1.027
% of Variance 52.782 10.312 4.668
Alpha .950 .913 .878
Extraction Method: Principal Component Analysis.
Rotation Method: Varimax with Kaiser Normalization.
a. Rotation converged in 6 iterations.
Thus based on the above discussion, the instrument was assumed to be valuable and reliable to collect
data from the sample.
Data Collection
The study was designed to collect data from two sets of samples; service providers and service users.
Data were collected from 2247 users (students + teachers) and 91 library professionals randomly
selected from eight state universities governed under UGC of Sri Lanka viz. The University of
Peradeniya, University of Sri Jayewardenepura, University of Kelaniya, University of Jaffna,
University of Ruhuna, Rajarata University, and Wayamba University. The questionnaires (1-4) were
distributed among librarians via e-mail in February 2021 collected within two weeks. Questionnaire 5
was distributed among user samples physically (and through a Google form in cases of physical
unavailability) with the support of the librarians of select universities. Simple statistical analysis was
performed to determine the average and percentage of responded values.
Results and Discussion
The response rate was 75% which is satisfactory for the analysis. An initial exploratory factor analysis
nd
(SPSS 22 version) run separately for each questionnaire verified the factor structure proposed in the
model and each item of all five questionnaires indicated the Eigenvalues over 0.50 assuring the
146