
Page 161 - Proceedings-edit-2021_09_20-final
P. 161
© Proceedings of the Ruhuna Quality Assurance Sessions 2021 (RUQAS 2021)
st
21 September 2021
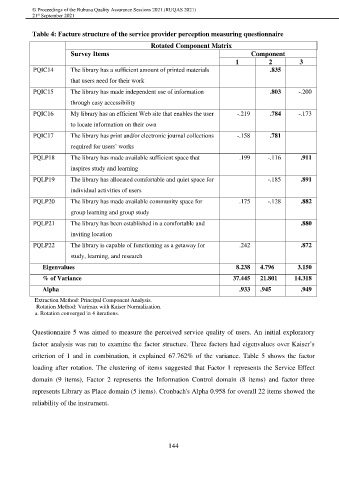
Table 4: Facture structure of the service provider perception measuring questionnaire
Rotated Component Matrix
Survey Items Component
1 2 3
PQIC14 The library has a sufficient amount of printed materials .835
that users need for their work
PQIC15 The library has made independent use of information .803 -.200
through easy accessibility
PQIC16 My library has an efficient Web site that enables the user -.219 .784 -.173
to locate information on their own
PQIC17 The library has print and/or electronic journal collections -.158 .781
required for users’ works
PQLP18 The library has made available sufficient space that .199 -.116 .911
inspires study and learning
PQLP19 The library has allocated comfortable and quiet space for -.185 .891
individual activities of users
PQLP20 The library has made available community space for .175 -.128 .882
group learning and group study
PQLP21 The library has been established in a comfortable and .880
inviting location
PQLP22 The library is capable of functioning as a getaway for .242 .872
study, learning, and research
Eigenvalues 8.238 4.796 3.150
% of Variance 37.445 21.801 14.318
Alpha .933 .945 .949
Extraction Method: Principal Component Analysis.
Rotation Method: Varimax with Kaiser Normalization.
a. Rotation converged in 4 iterations.
Questionnaire 5 was aimed to measure the perceived service quality of users. An initial exploratory
factor analysis was run to examine the factor structure. Three factors had eigenvalues over Kaiser’s
criterion of 1 and in combination, it explained 67.762% of the variance. Table 5 shows the factor
loading after rotation. The clustering of items suggested that Factor 1 represents the Service Effect
domain (9 items), Factor 2 represents the Information Control domain (8 items) and factor three
represents Library as Place domain (5 items). Cronbach's Alpha 0.958 for overall 22 items showed the
reliability of the instrument.
144