
Page 165 - Proceedings-edit-2021_09_20-final
P. 165
© Proceedings of the Ruhuna Quality Assurance Sessions 2021 (RUQAS 2021)
21 September 2021
st
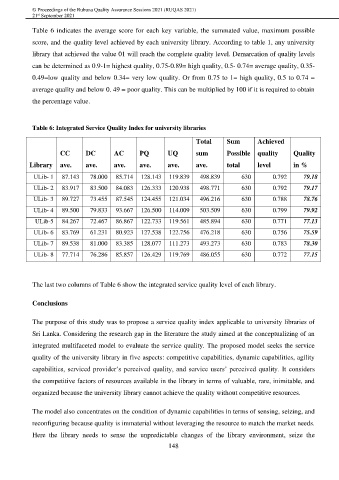
Table 6 indicates the average score for each key variable, the summated value, maximum possible
score, and the quality level achieved by each university library. According to table 1, any university
library that achieved the value 01 will reach the complete quality level. Demarcation of quality levels
can be determined as 0.9-1= highest quality, 0.75-0.89= high quality, 0.5- 0.74= average quality, 0.35-
0.49=low quality and below 0.34= very low quality. Or from 0.75 to 1= high quality, 0.5 to 0.74 =
average quality and below 0. 49 = poor quality. This can be multiplied by 100 if it is required to obtain
the percentage value.
Table 6: Integrated Service Quality Index for university libraries
Total Sum Achieved
CC DC AC PQ UQ sum Possible quality Quality
Library ave. ave. ave. ave. ave. ave. total level in %
ULib- 1 87.143 78.000 85.714 128.143 119.839 498.839 630 0.792 79.18
ULib- 2 83.917 83.500 84.083 126.333 120.938 498.771 630 0.792 79.17
ULib- 3 89.727 73.455 87.545 124.455 121.034 496.216 630 0.788 78.76
ULib- 4 89.500 79.833 93.667 126.500 114.009 503.509 630 0.799 79.92
ULib-5 84.267 72.467 86.867 122.733 119.561 485.894 630 0.771 77.13
ULib- 6 83.769 61.231 80.923 127.538 122.756 476.218 630 0.756 75.59
ULib- 7 89.538 81.000 83.385 128.077 111.273 493.273 630 0.783 78.30
ULib- 8 77.714 76.286 85.857 126.429 119.769 486.055 630 0.772 77.15
The last two columns of Table 6 show the integrated service quality level of each library.
Conclusions
The purpose of this study was to propose a service quality index applicable to university libraries of
Sri Lanka. Considering the research gap in the literature the study aimed at the conceptualizing of an
integrated multifaceted model to evaluate the service quality. The proposed model seeks the service
quality of the university library in five aspects: competitive capabilities, dynamic capabilities, agility
capabilities, serviced provider’s perceived quality, and service users’ perceived quality. It considers
the competitive factors of resources available in the library in terms of valuable, rare, inimitable, and
organized because the university library cannot achieve the quality without competitive resources.
The model also concentrates on the condition of dynamic capabilities in terms of sensing, seizing, and
reconfiguring because quality is immaterial without leveraging the resource to match the market needs.
Here the library needs to sense the unpredictable changes of the library environment, seize the
148